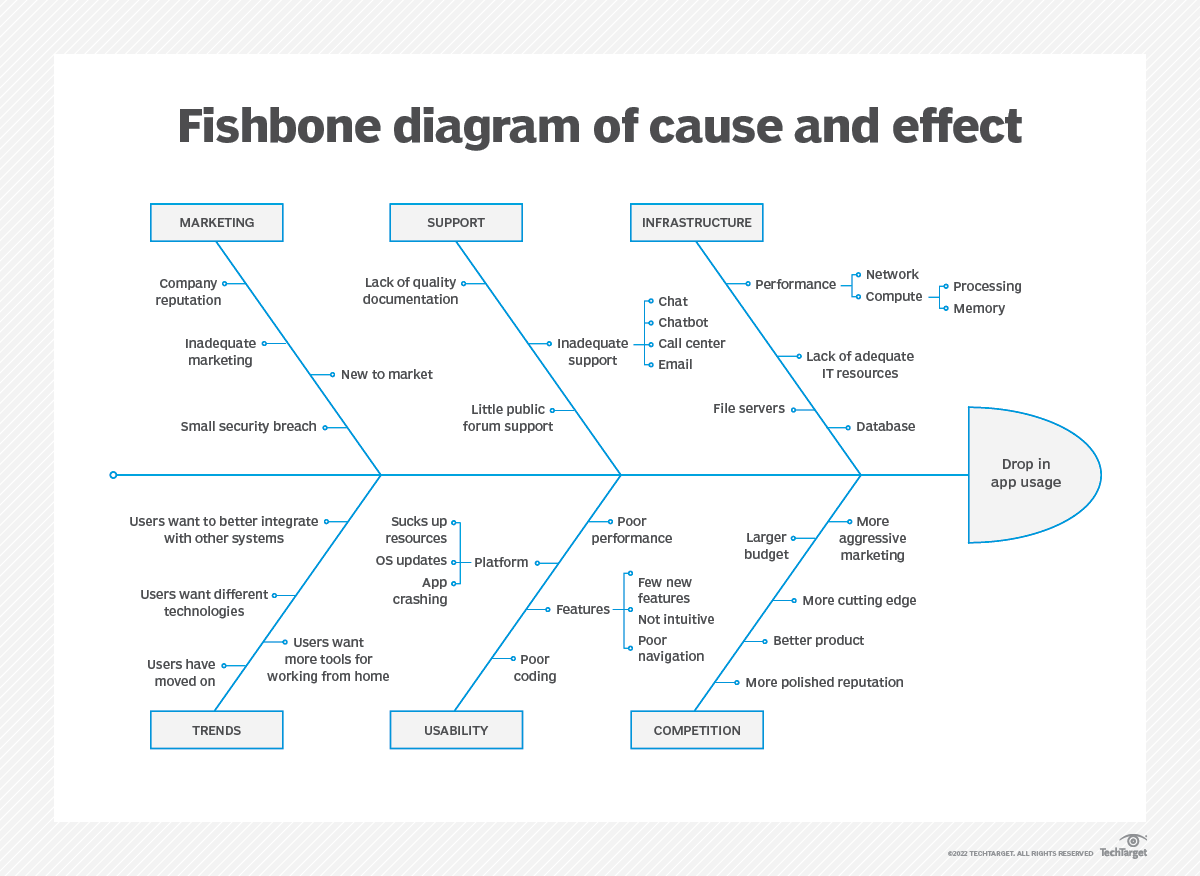
2.1.4.3. Fishbone Diagram#
A fishbone diagram, also known as an Ishikawa diagram or cause-and-effect diagram, is a visual tool used to identify the root causes of a problem or issue. The diagram is structured like a fish skeleton, with the problem statement or effect at the head of the fish and branches representing different categories of causes.

Here’s how it works:
Identify the problem: The first step in creating a fishbone diagram is to identify the problem or effect that you want to analyze. This is written at the head of the fish.
Identify major categories of causes: The next step is to identify the major categories of causes that could be contributing to the problem. These are written as branches off the main backbone of the fish. Some common categories include people, process, equipment, environment, and materials.
Identify subcategories of causes: Under each major category, identify the specific subcategories of causes that could be contributing to the problem. These are written as branches off the major category branches.
Identify potential causes: Under each subcategory, identify the potential causes that could be contributing to the problem. These are written as branches off the subcategory branches.
Analyze the diagram: Once the diagram is complete, it can be used to analyze the potential causes of the problem and to identify the root cause or causes. This can help to develop more effective solutions that target the underlying cause of the problem rather than just treating the symptoms.
Fishbone diagrams are useful because they help to break down complex problems into smaller, more manageable components. They also encourage collaboration and communication among team members, as different perspectives and ideas can be incorporated into the diagram.